Nearest Neighbour Identification
In my attempts to learn more about different machine learning methods I found the Machine Learning Fundamentals course by Bob Trenwith which I've been going through and trying some examples. This blog post is about the nearest neighbour identification algorithm. Bob Trenwith did a tremendous job explaining it and so I recommend watching his video on the topic that can be found in the playlist, but here is a simplified explanation.In this machine learning algorithm you take your test sample, and compare it to every single value in your training set, and find the one that is the most similar to it or is the least different.
For this type of algorithm I used the MNIST dataset of handwritten numbers. I downloaded the dataset and used the documentation from this website. This is a database of hand written numbers in a 28x28 grid where each pixel is assigned a value from 0-255 (completely opaque to filled in). This is done through having an array of 785 values where the first value is the number represented in the drawing.
So what I did in this code was I took a random hand written number from the test sample set and compared it to every single value in the training set. For each number in the training set I compared all 784 data points (excluding the first number as that is the value of the number itself) to the 784 data points of the test number through Euclidean distance (or at least some version of it) here is a representation of what Euclidean distance is:
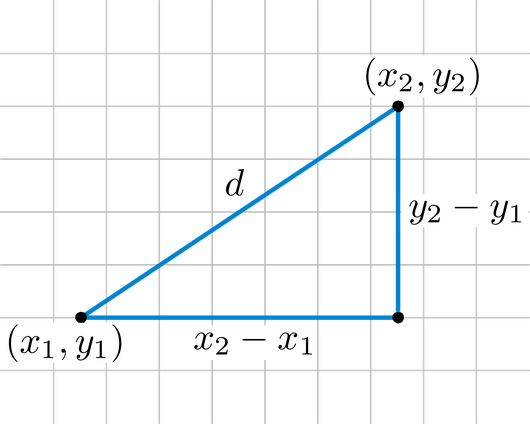
I know this still might sound complicated but in practice it is quite simple. You want to find the value of d from two numbers. Let's say the two values we want to compare are x and y. You convert these values into vectors where x2 - x1 = x and y2 - y1 = y in order to find the difference between them you simply use the Pythagorean theorem by doing d = (x^2 + y^2)^(1/2) This equation gives you the difference between these two values. When this calculation is done for every single datapoint in both of the hand written numbers (test and train) the result of which is added to an overall difference, you can evaluate the value in the training set that is the most similar to the test value. This number, or its nearest neighbour, is then returned.
Here is the code:
Unfortunately this platform doesn't allow me to indent so if you want to use this code feel free to contact me.
#%matplotlib inline
import math
import numpy as np
import random
import matplotlib.pyplot as plt

image_size = 28 # width and length
no_of_different_labels = 10 #  i.e. 0, 1, 2, 3, ..., 9
image_pixels = image_size * image_size
data_path = "data/mnist/"
train_data = np.loadtxt(data_path + "mnist_train.csv",
                        delimiter=",")
test_data = np.loadtxt(data_path + "mnist_test.csv",
                       delimiter=",")

random_num = random.randint(0,len(test_data))

input = test_data[random_num]

lowest_value = 100 ** 5
lowest_value_index = -1

for number in train_data:
    difference = 0;
    current_index = -1
    for i in range(1, len(number)):
        x = input[i] ** 2
        y = number[i] ** 2
        eculid_space_difference = math.sqrt(x + y)
        difference = difference + eculid_space_difference
        current_index = i
        if difference < lowest_value:
            lowest_value = difference
            lowest_value_index = current_index

print(lowest_value)
print("Most Likely the number:")
print(train_data[lowest_value_index])
print("Input:")
print(input)
Komentáre
Zverejnenie komentára